Monday, July 27, 2009

*ORA: Unifying Pajek net files has never been easier

Legal stuff of *ORA

*ORA is NOT free software, just like many of the network visualization tools out there.

According to it's "About *ORA" dialog box "Permission to use, copy and modify this version of the software or any parts of it and its documentation is hereby granted for RESEARCH ONLY purposes and provided that the above copyright notice and this permission notice appear intact in all copies of the software that, that you do not sell the software, nor include the software in a commercial package."

*ORA is a copyright (2001-2008 of the version I'm using) of Kathleen M. CArley, Center for Computational Analysis of Social and Organizational Systems (CASOS). Institute for Software Research International (ISRI), School of Computer Science (SCS), and Carnegie Mellon University(CMU).

The version I'm reviewing is 1.9.5.29 with a build date of July 2008 in Ubuntu. And version 1.9.5.4.3 in Vista with a build date of June 2009.

*ORA is available at http://www.casos.cs.cmu.edu/projects/ora/

I am not connected to the copyright holders.

Why is the union of networks in Pajek wrong?

When you hit Menu->Union of vertices in Pajek it doesn't seem to take into account labels. It will simply add all the vertices resulting in duplicate vertices with the same label.

What is *Ora?

According to its homepage at the Computational Analysis of Social and Organizational Systems (CASOS) "*ORA is a risk assessment tool for locating individuals or groups that are potential risks given social, knowledge and task network information." That description may mislead people to think that this tool is only a very specialized network visualization-analysis tool. I found that it is probably the most advance and user friendly, free network analysis tool out there that can be used for all kinds of networks. It is particularly powerful because of its application of metamatrices, and appear to be able to analyze semantic, social, organizational, communication, etc. networks at the same time.

Although I haven't explored it's full potential yet, one particular application is the union of pajek networks. I can't seem to import netdraw files yet, or include the vector files associated with the pajek networks. But perhaps there is a way I haven't found yet.
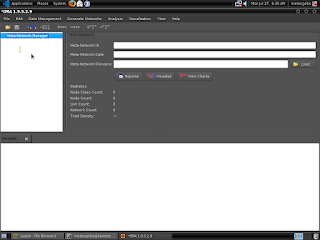


How to make a union of networks in *ORA
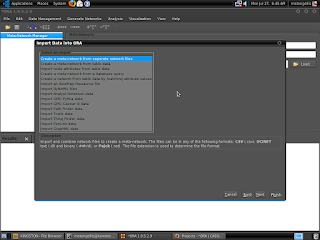


1. In *ORA click menu->File->Data import wizard... or Ctrl-O 2. A dialogue box will appear, select "Create a meta-network from separate network files" and click "Next"
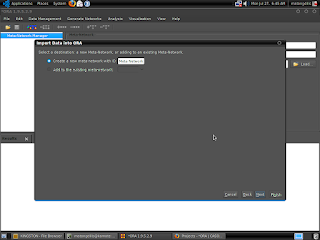
3. In the next dialogue box, I just left the default value of "Create a new meta-network with ID: Meta Network" then I hit Next.

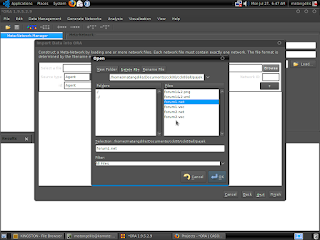
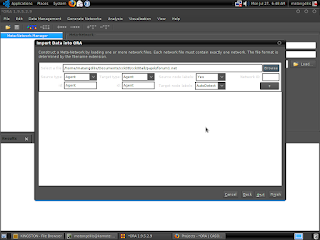
4. A dialogue box for choosing the networks to load in *ORA will appear. Just Browse for your file and hit OK.
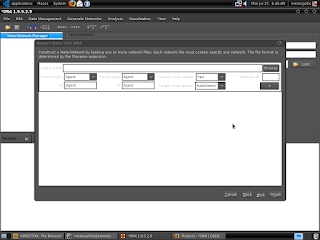
I you have more than one network file just click the plus (+) button and another browsing textbox will appear.

I've experienced *ORA complained about the filename of networks like forum1.net, forum2.net. It interpreted it as being the same network. So what I did was to import one network at a time. I don't know if it would be different had I changed the names of the second network.

You can select the type of metamatrix from the drop-down boxes. Since mine is composed of actors, I selected "Agent" as Source type and Target type. I also set "Source node labels: Yes".

Click Finish.

5. A small dialogue box will appear asking "Would you like to anonymize the data?" I hit "No" because I need the labels for the union network. You can always anonymize the data later with menu->Data Management->Meta-Network Anonymize...

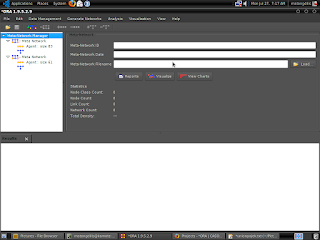
6.All your loaded network will appear in the left panel. This should be familiar to people using the Network Workbench Tool.
7. To make a union of the two network (in my example one is size 83 and the other is size 61) click menu->Data Management->Meta-Network Union...

A dialogue box will appear. I kept the default "Currently loaded in ORA" and set "Select how to combine link weights" to Sum.

Then hit Compute.

8. It will create a new Network in the left panel with the name Union. Mine produced a network with 108 vertices from size 83 and 61 networks. Whereas Pajek will create a 144 size network.

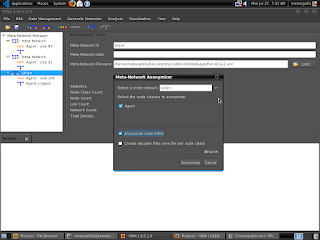
9. To Anonymize the network select the Union network in the panel click menu->Data Management->Meta-Network Anonymize... or simply right click the Union network in the panel and select Anonymize...
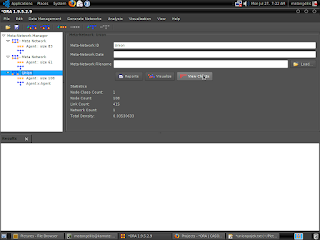

It will show a dialogue box wherein I checked "Anonymize node titles". You can even create decoder files. Then hit the Anonymize button.
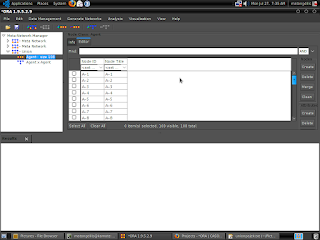
To examine your labels, just select Agent in the panel like in the figure. YOu can see the Node Titles are A-1, A-2 etc.
10. You can examine your Union network with menu->Visualization->Network visualizer->View Entire Meta-Network. It's visualizer is still sluggish and not as impressive as Pajek, but it could be because I'm using the wrong OS platform. See below. It seems it's using JUNG (http://jung.sourceforge.net) library for visualization.

Then click ORA Network Visualizer->menu->Save Image To File...
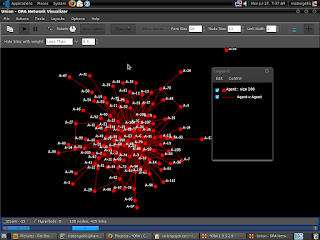

You can save the graph in PNG, JPG, SVG, and PDF formats.

And here's the output.
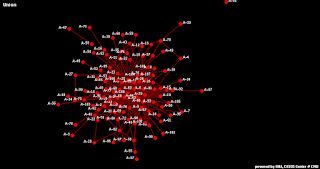
11. Converting from *ORA's DynetML to NetDraw's VNA

*ORA'S Network Format Converter will convert from DyNetML, ASSAMML, UCINET, CSV, and DL to DyNetML, UCINET, DL, CSV, and VNA.
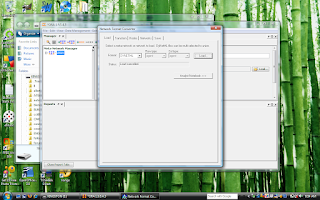

Click on File->Network Format Converter and a dialogue box will appear. In the Load tab, select Format DYNETML and Load your Union file that was saved as .xml.
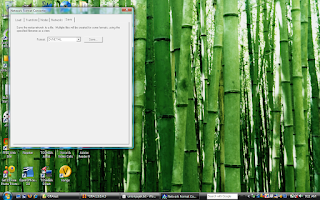

Then go to the Save tab, and select VNA and save.

Here's a graph render of the VNA output in NetDraw.
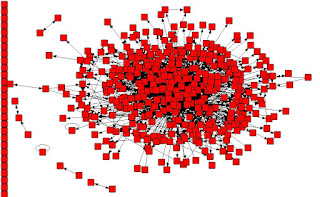


Problems encountered

I installed the Windows version in a Vista machine. But I coudld not import any network files. It resulted in Java errors.

I was able to import graphs in the Ubuntu Linux Jaunty installation. But *ORA seems 32 bit and I had 64 bit installed. It had a lot of GTK related errors, particularly with the canberra-gtk-module. So it was a bit buggy and I couldn't use the Network Format Converter because it would not open.

I had to shift to the Windows version with the saved DyNetML xml file, and convert it there. I don't think it converts back to Pajek net file though.

Perhaps if I can resolve the 32 bit GTK problem in my installation or install a 32 bit Ubuntu things will be better. But I managed to make a proper union of the networks without resorting to cumbersome spreadsheet techniques.

Unfortunately, I haven't been able to unify the vectors yet.

Aside from that, I don't know how *ORA will handle very large networks.

I think, if the developers continue to improve *ORA, particularly its visualizer it will become even better than Pajek in the future.

But remember that *ORA is NOT free software and is available only for research. Pajek too is proprietary and according to its "About Pajek" dialogue box is free (as in free beer) for noncommercial use only. I personally haven't found a free (beer) tool that equals Pajek in speed, visualization, and analysis.

The Network Workbench Tool (version 12.0.0 beta), a copyright of Indiana University is licensed under Apache License Version 2.0. Gephi version 0.5 Beta is GPL 3.0 (gephi.org) but it is only a graph editor. Perhaps Gephi can be partnered with the sna 2.0 R package (http://erzuli.ss.uci.edu/R.stuff) from Carter Butts which is GPL 2.0 and later.

References

Kathleen M. CArley, Center for Computational Analysis of Social and Organizational Systems (CASOS), Institute for Software Research International (ISRI), School of Computer Science (SCS), and Carnegie Mellon University(CMU). *ORA [Software]. Available at http://www.casos.cs.cmu.edu/projects/ora/

Butts, C.T. The SNA Package, v2.0 [Software]. Available at http://erzuli.ss.uci.edu/R.stuff

Indiana University. The Network Workbench Tool [Software]. Available at http://nwb.slis.indiana.edu/download.html.

R Development Core Team (2009). R: A language and environment for statistical computing. R Foundation for Statistical Computing, Vienna, Austria. ISBN 3-900051-07-0, URL http://www.R-project.org.


V. Batagelj, A. Mrvar: Pajek – Program for Large Network Analysis. Home page: http://vlado.fmf.uni-lj.si/pub/networks/pajek/

Sunday, July 26, 2009

Union of all CCK08 Moodle Forums Social Network

Let me state first as an errata, that I have NOT been given any formal approval to study the CCK08 Moodle forums by Prof. Siemens or Prof. Downes, but was merely informed that they are publicly available. The data, graphs and research plan here is NOT connected nor endorsed by the said professors or their institution. All liability and errors are mine. I am doing this as a private individual and in good faith.

(EDIT: Removed grumbling about research ethics and replaced it with dataset- July 27, 2009)
I've been thinking all night about my ethical dilemma about getting consent from 536 CCK08 Moodle forums participants. I've decided to make an 180 degree turn around. I've decided to release the dataset, because the graphs are totally useless without them. So here they are.

Dataset of anonymized union of all forums in Pajek format (14.85 KB) http://www.mediafire.com/file/m0n3oritnof/cck08allforums_pajek.zip

Here is my justification, the SNA analysis processed two information from the interface of the Moodle forums, which is publicly available. The first is the names of the poster which was used as an id to identify vertices across the forum. The second information is the message id that was autogenerated by Moodle when the poster click reply or post. The body of the message was not touched at all. Gathering the participants' email addresses on top of their names seems to me exacerbating my ethical problem. It's like I need to gather more information about them without their consent so that I can ask their consent to get information that I already have. I have anonymized the Moodle participants' names, and that is all I can do. I can only claim "in the interest of science" as defense i.e. so that discussion about the theory will have hard data to stand on.

Any one who reads this blog and wants me to delete the dataset, just post it in the comment and I'll consider it.

(END of edit-July 27, 2009)

Caveat emptor, this social network of the CCK08 moodle forums can not tell us the whole story of CCK08. There are only 560 registered users. The others probably had their centrality in the blogs, wiki, facebook, twitter etc.

Even some of the isolates and peripheral participants in the moodle network may be in the other networks. I know a peripheral participant in the moodle network who was an active blogger. I myself posted only 7 times in the forum and centered my learning in the wiki resources.

Another source of uncertainty is what I have reported before, the type I error (wrong ties) and type II error (unreported ties).

Let me start with some basic parameters of the social network.

Table 1: Network Parameters of CCK08 Moodle forums
Forums total initial posts Total Replies Total Posts Participants % of total unique actors (n =537)
1 (Introduction) 494 798 1292 501 93.3
2 (General) 122 1283 1405 165 30.73
3 (forum 1) 11 301 312 83 15.46
4 (forum 2) 25 291 316 61 11.36
5 (forum 3) 26 427 453 48 8.94
6 (forum 4) 7 131 138 28 5.21
7 (forum 5) 19 252 271 42 7.82
8 (forum 6) 16 96 112 30 5.59
9 (forum 7) 15 117 132 25 4.66
10 (forum 8) 17 244 261 85 15.83
11 (forum 9) 13 133 146 28 5.21
12 (forum 10) 11 77 88 24 4.47
13 (forum 11) 10 143 153 35 6.52
14 (forum 12) 14 105 119 29 5.4
grand total 800 4398 5198 537 (unique actors)


560 (registered users)


Figure 1: Frequency of initial posts in the forums


Figure 2: Frequency of total replies in the forums


Figure 3: Frequency of total posts in the forums


Figure 4: Frequency of participants in the forums

All line graphs were generated with R.


CCK08 Moodle Forums Social Network

Dataset: http://www.mediafire.com/file/m0n3oritnof/cck08allforums_pajek.zip

Pajek renders (fruchterman reingold 2D layout)

Figure 5: Union of all forums without tie strength


Figure 6: Union of all forums without tie strength and frequency of posts as vector (size of vertices)


Figure 7: Union of forums with tie stregth

Figure 8: Union of forums with tie strengths and frequency of posts as vector (size of vertices)

Netdraw Renders (spring embeddeding layout)


Figure 9: No tie strength


Figure 10: With tie strength

Figure 11: Scale 1:1 of total posts attribute represented as sizes of nodes

Figure 12: Figure 11: Scaled to minimum size 4:maximum size 50 of total posts attribute represented as sizes of nodes

One way to connect the isolates in the moodle network with the bloggers is to look at the moodle activity logs (which is only available to the site admin), and probably to mine it with Weka. Then find out which of the core moodle participants they are following. Afterwards compare the semantic network of their blogs with the semantic networks of the said participants.

An interested researcher may do semantic network analysis of the CCK08 Moodle core participants posts probably with Kathleen Carley's Automap or Carter Butts' The metamatrix package for organizational analysis, a package for R.

(Edited July 27, 2009)
Despite the research ethics issue and my aching clicking arm, eyes and back, I've learned a lot from this attempt. I'll probably use the method I've learned here in a dataset where I have taken all necessary ethical requirements. All in all it was fun.
(Edited July 27, 2009)

References:

Borgatti, S. Netdraw [Software]. Available at http://www.analytictech.com/Netdraw/netdraw.htm.

R: A Language and Environment for Statistical Computing
. R Development Core Team. R Foundation for Statistical Computing. Vienna, Austria, 2009,ISBN 3-900051-07-0}, http://www.R-project.org.

V. Batagelj, A. Mrvar: Pajek - Program for Large Network Analysis. Home page
http://vlado.fmf.uni-lj.si/pub/networks/pajek/.

Monday, July 20, 2009

CCK09: Validating Aneesha Bakharia's SNA Moodle Tool

Since I am unaware of any other validated tool to compare the data output of Bakharia's SNA Moodle Tool I would have to manually verify its reliability and validity. I am only going to show the method here and use a single discussion thread as an example.

My approach involves using the Firefox extension Web Developer to expose the message IDs and link details.

In Web Developer->Information->Display Id & Class Details, and Information->Display link details are enabled.


Figure 1: A CCK08 discussion thread opened in Firefox with Web Developer enabled

The figure above shows that Moodle forums identify each post with an ID. The initial post has an id #p3199. The same ID is displayed in the "Reply" link in the lower right corner of the message box.

Replies identify the parent message replied to which in the figure is encircled green as #p3199, and beside it is the link to the id of the reply e.g. #p3204 for the 1st reply.

This is how an automated method of data gathering is able to link a reply post to a parent post.

Reliability

The reliability issue with the SNA Moodle Tool is whether it is able to capture this data accurately. Firstly is whether it accurately count the frequency of posts by each actor. And secondly is whether the Moodle SNA Tool name pair ties is congruent to the HTML id pair ties.

Table 1: Name pairs versus ID pairs in the discussion thread

VNA DATA
HTML DATA


*Node data


ID posts POST NAME POST ID NO. OF POSTS EQUAL?
A 1 A 3284 1 yes
B 1 B 3491 1 yes
C 1 C 3327 1 yes


D 3710 1


D 3713 1


D 3879 1


D 3880 1


D 3887 1


D 3901 1


D 4032 1


D 4037 1
D 8

8 yes
E 1 E 3969 1 yes
F 1 F 3470 1 yes
G 1 G 5518 1 yes


H 3443 1


H 3535 1


H 3742 1


H 3871 1


H 4024 1
H 5

5 yes
I 1 I 3679 1 yes
J 1 J 3652 1 yes
K 1 K 3300 1 yes
L 1 L 3302 1 yes
M 1 M 3515 1 yes
N 1 N 3650 1 yes


O 3199 1


O 3271 1


O 3384 1


O 3595 1


O 3674 1


O 3695 1


O 3726 1


O 3744 1


O 3746 1


O 3747 1


O 3753 1


O 4034 1
O 12

12 yes
P 1 P 3768 1 yes


Q 3205 1


Q 3635 1


Q 3668 1
Q 3

3 yes
R 1 R 3605 1 yes


S 4061 1


S 4064 1
S 2

2 yes


T 3730 1


T 3737 1


T 3752 1


T 3754 1


T 3755 1


T 3885 1


T 3886 1


T 3893 1


T 3911 1


T 4001 1


T 4042 1


T 4089 1
T 12

12 yes
U 1 U 3204 1 yes
V 1 V 4178 1 yes


W 3381 1


W 3455 1


W 3734 1


W 3750 1
W 4

4 yes
X 1 X 3337 1 yes


Y 3285 1


Y 3335 1


Y 3678 1


Y 3705 1
Y 4

4 yes


Z 3924 1


Z 3926 1


Z 3927 1
Z 3

3 yes


AA 3293 1


AA 3365 1
AA 2

2 yes


BB 3545 1


BB 3604 1


BB 3609 1


BB 3774 1
BB 4

4 yes


CC 3222 1


CC 3612 1


CC 3873 1
CC 3

3 yes


Table 1 shows that there is 100% equivalence between the frequency of posts in the tool, and that of the html posts.


By listing in a table, manually, the id pairs associated with names I am able to test the reliability of the tool.

Table 2: Tie data and posts ids; Names in content.

*Tie data Is it correct id/name pair?
explicitly addressed Is it the right person?
other
from to
strength


A3284 CC3222 yes 1


B3491 W3381 yes 1


C3327 O3199 yes 1


D4032 H4024 yes
H yes

D3879 H3871 yes 2


D4037 T3911 yes


D3887 T3886 yes 3


D3901 T3885 yes


D3710 BB3609 yes 1


D3880 CC3873 yes


D3713 CC3612 yes 2 CC yes

E3969 T3754 yes 1 T yes

F3470 AA3293 yes 1 A yes

G5518 O3199 yes 1


H4024 D3710 yes 1 D yes

H3535 M3515 yes 1 M yes

H3871 T3754 yes 1 T yes

H3443 W3381 yes 1 W yes

H3742 BB3609 yes 1


I3679 CC3612 yes 1


J3652 Q3635 yes 1 ??? no (name not in discussion)

K3300 Y3285 yes 1 Y yes
H
L3302 AA3293 yes 1


M3515 H3443 yes 1


N3650 R3605 yes 1 R yes

O4034 D3710 yes 1 D yes

O3384 K3300 yes 1 K yes

O3747 O3746 yes 1


O3674 Q3635 yes 1 Q yes

O3746 T3737 yes 1 T yes
W
O3271 U3204 yes 1 U yes

O3753 W3750 yes 1 W yes
T
O3726 Y3705 yes


O3695 Y3678 yes 2 Y yes

O3595 BB3545 yes 1 BB yes

O3744 CC3612 yes 1 CC yes

P3768 O3744 yes 1


Q3668 J3652 yes 1 J yes

Q3635 O3384 yes 2


Q3205 O3199 yes


R3605 Y3285 yes 1


S4061 D4037 yes 1 D yes

S4064 T3730 yes 1 T yes

T3730 D3710 yes


T3893 D3887 yes


T3911 D3901 yes


T3886 D3879 yes 5


T4042 D4037 yes


T4001 E3969 yes 1


T3885 H3871 yes 1


T3755 O3753 yes


T3754 O3747 yes 2


T4089 S4064 yes 1


T3737 W3734 yes 2


T3752 W3750 yes


U3204 O3199 yes 1


V4178 T3893 yes 1


W3455 H3443 yes 1 H yes

W3750 O3746 yes
O yes

W3734 O3674 yes 2 O yes
Q
W3381 Y3335 yes 1


X3337 Y3335 yes 1


Y3335 C3327 yes 1


Y3705 O3695 yes 1


Y3678 R3605 yes 1


Y3285 U3204 yes 1


Z3924 O3384 yes 2 O yes

Z3927 O3199 yes
O yes

Z3926 Q3635 yes 1 Q yes

AA3293 A3284 yes 1


AA3365 Y3335 yes 1


BB3609 H3443 yes 2 H yes

BB3774 H3742 yes
H yes

BB3604 O3595 yes
O yes

BB3545 O3199 yes 2


CC3873 D3713 yes 1


CC3612 O3199 yes


CC3222 O3199 yes 2


100% reliability 78 total explicitly named 32 (41.03%) total other named 4 (5.13 %)


total right name 31 (39.74%) % other/32 12.50%


%right name/32 96.88%


total wrong person 1 (1.28%)


% wrong name/32 3.13%


Column 3 of Table 2 shows that there is 100% reliability in the congruence of name pairs in the SNA tool and the id pairs in the html.

Validity

How sure are we that the person being resplied to as indicated in the html ids of the parent post is the actual person addressed in the content?

In Column 4 of Table 2 32 (41.03%) of 78 replies explicitly named the person being addressed. 31 (39.74%) is congruent with the parent post id, while 1 (1.28%) addressed a name that is not in the discussion. But looking at the context, the person who is addressed ignored the wrong name and replied. So I interpret it as an honest mistake.

If the sample n (32) is used then 96.88% of the names are correct while 3.13% is incorrect.

Lost Information

What about people who were addressed in the same post but were not reflected in the parent id. In Column 6 of Table 2, 4 (5.13%)post of 78 had two persons addressed in the same posts. This is 12.5% of all explicitly named replies (32) for this sample thread.

Another information lost is which messages are replies to which particular messages. Since the vertices in the SNA Tool represent actors, we can see from the tables that all similar ties, and all posts by the same actor are aggregated.

The SNA Tool have actors as vertices and would produce the following graph for this thread.

Figure 2: Pajek graph of SNA Moodle tool data

While making the particular posts as nodes and the actor id as partition will produce this graph.

Figure 3: Pajek output of posts from html discussion page

This last look to me like a communication graph, and not a social network.

Both graphs are less rich in data as opposed to what has been tried here: http://www.flickr.com/photos/37794987@N00/2854506800/ (x28x28de, 2008). This appears to me an overlay of an SNA graph (head icons) and a communication graph (vertices). This also has a time element. But it is difficult to see the connections at an instant with this approach. Perhaps if it was in 3d it would be better.

Dataset for graphs (33.09 kb) : http://www.mediafire.com/file/dygmojkmqyn/verifySNAtool1.zip

Plan

This only outlines the approach. To generalize, I am going to use stratified random sampling (Best & Kahn, 1989). I would need 99 sample discussion threads (groan) to be subjected to this approach.

I will check the number of posts and the name pairs. Also, the distribution of the proportions of verified names in the content, wrong names, and lost ties (others addressed in the content) will be analyzed across the sample.

My concern is how to test for statistical significance of these distributions of proportions? I wonder if a z-test will do?


References

Bakharia, A. & Dawson, Shane. Moodle SNA Analysis [Javascript program]. In Blackboard and WebCT - forum social network Analysis Tool. Random Syntax [Blog]. Retrieved July 12, 2009, from http://www.randomsyntax.com/blackboard-forum-social-network-analysis/.

Best, J.W., & Kahn, J.V. (1989). Research in education (6th ed.). New Jersey: Prentice-Hall, p.14 .

x28x28de. (2008, September 13). A centralized forum discussion. Retrieved July 20, 2009 from http://www.flickr.com/photos/37794987@N00/2854506800/.

Pederick, C. Web Developer 1.1.8, Firefox browser extension. [Software]. Available at https://addons.mozilla.org/en-US/firefox/addon/60. Developer homepage at http://chrispederick.com/work/web-developer/.
 
Creative Commons License
This work is licensed under a Creative Commons Attribution-Share Alike 3.0 Unported License.